Characteristics of the study
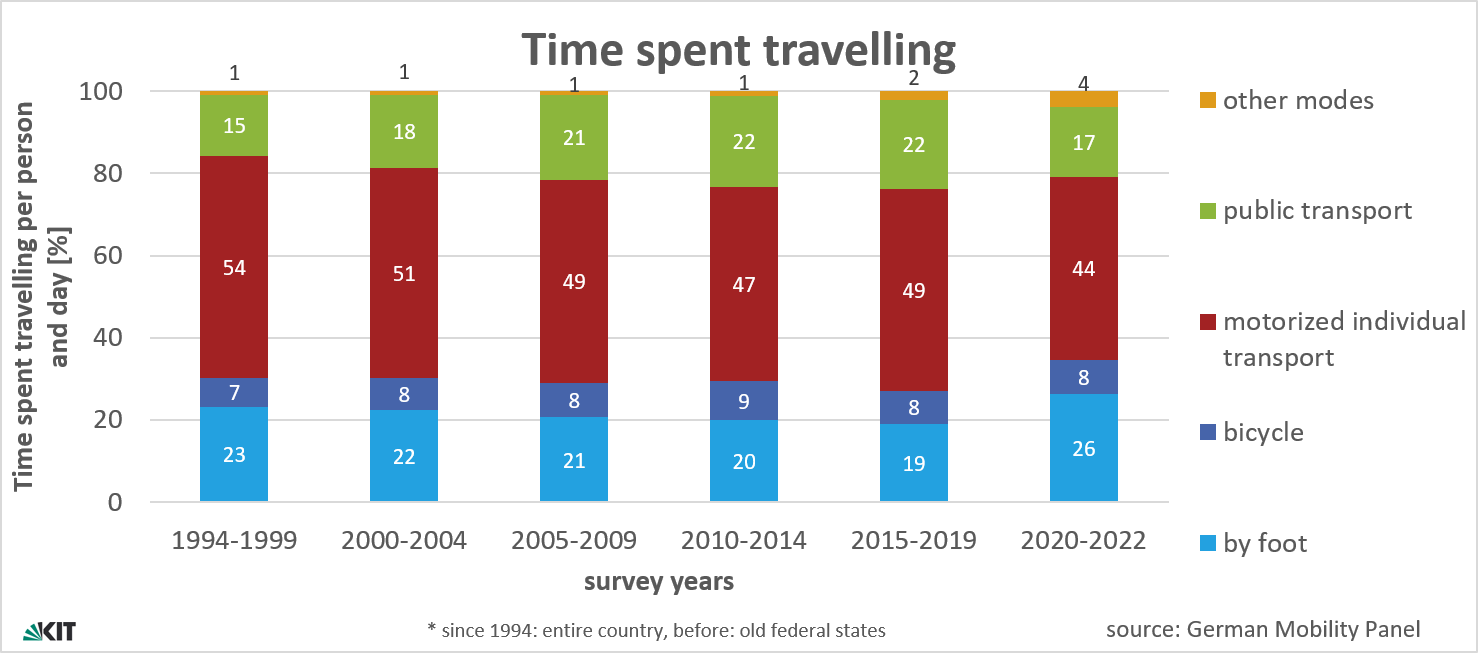
The German Mobility Panel is a longitudinal survey, which differentiates it from other surveys. The survey is repeated annually, so that the travel behaviour in Germany has been continuously observed over the last 25 years. The graphic below shows the change in the modal share based on travel time (time spent in the transport system with different transport means) . The graphic shows that Germans currently spend 22% of their mobility time in public transport. This figure has risen by 8% during the last 25 years. Time spent in motorized private transport decreased in the same period from 55% to 49%.
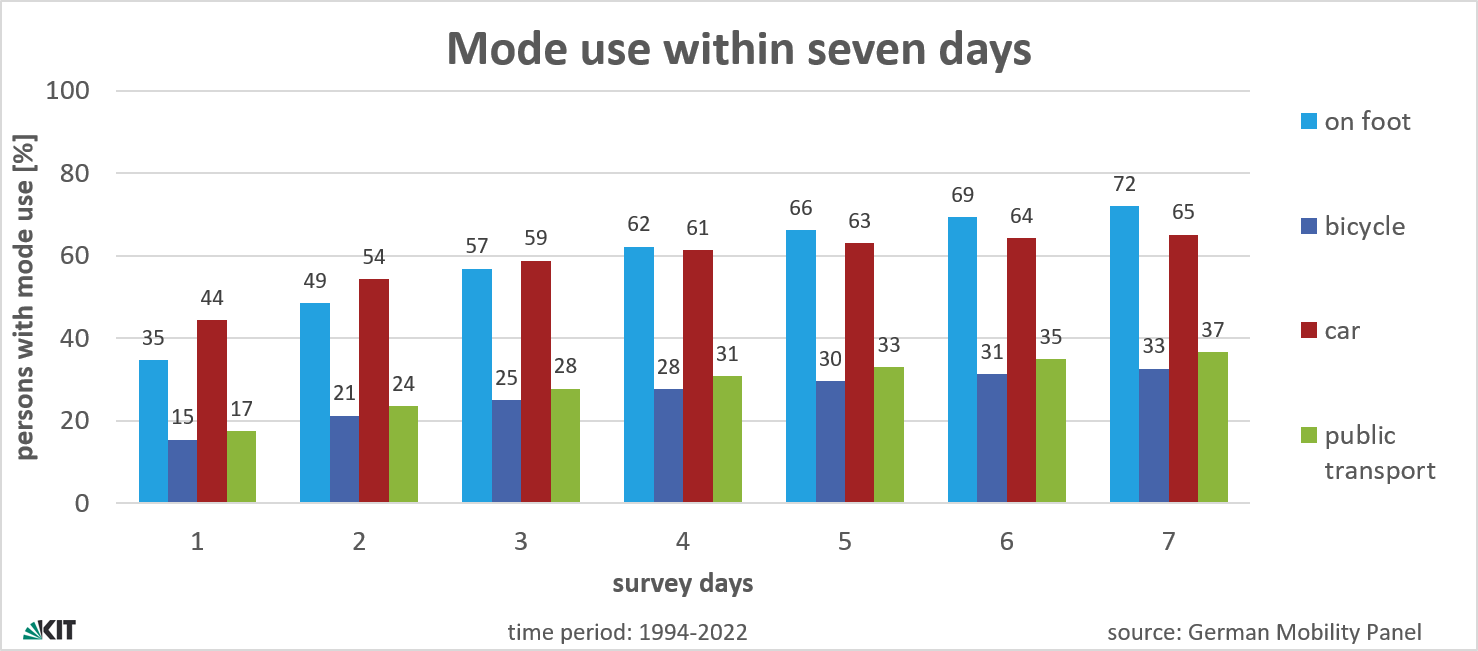
Observing people's mobility over one week and car use over eight weeks helps to analyse regular and irregular mobility patterns. For example, it can be analysed how people use different transport modes in the course of the week. The following graphic shows the percentage of respondents using the given transport modes at least one time in a period of seven days. If only one day is observed, 45% of the respondents use a car at least once while only 18% use public transport or the bicycle (16%). However, over one third of the respondents use the bicycle or public transport at least once within a period of seven days.
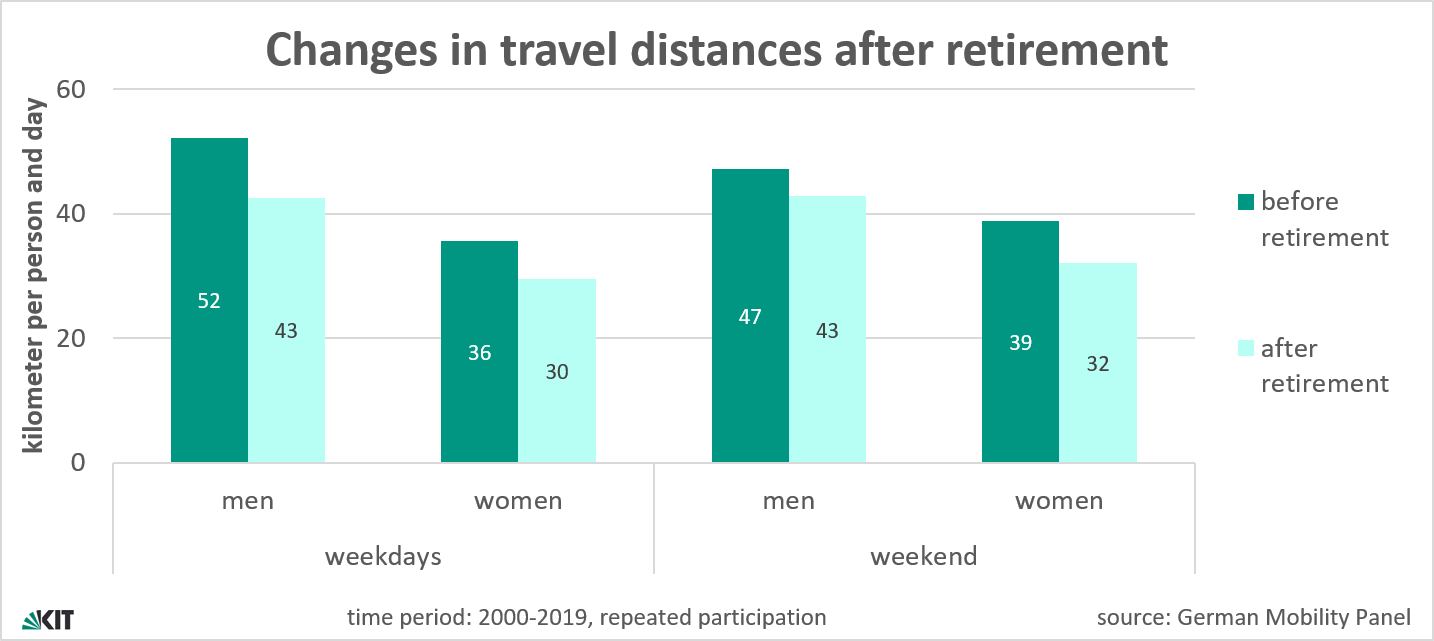
Furthermore, the German Mobility Panel is a panel survey with a rotating sample. Respondents are asked to participate during three consecutive years. Every year a part of the households is dropped from the subsequent wave and replaced with new households. This survey design helps to observe and to analyse changes or stability in travel behaviour of the same persons over three years. A person’s transport mode choice, for instance when deciding between the bicycle and another mode, may be influenced by the weather conditions the week of the survey. Also life changes such as the birth of a child, retirement or a job change may cause changes in travel behaviour. The graphic below shows the distance travelled per day by men and women on weekdays and weekends before and after retirement. The results show that the same persons travel 6 kilometres less per day than in their last year of work. The distance travelled per day also decreases on weekends. A reason could be that some activities, former typically undertaken on weekends, are moved to workdays after retirement.